
Why Average Rent by City Data Misleads Renters
Stop relying on misleading city-wide averages. Learn how to find the real average rent by city and neighborhood using Areal's transparent housing data.
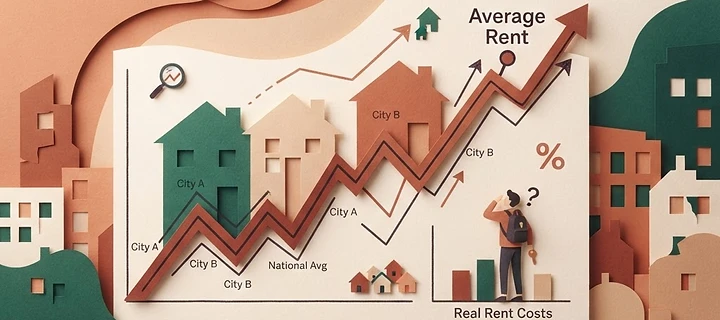
A report on the average rent by city provides a general baseline for a broad geographic area, but it often obscures the extreme price variance found between individual neighborhoods. Because these figures are usually aggregated at the municipal or county level using U.S. Census Bureau and HUD datasets, they fail to reflect the micro-markets that dictate your actual monthly housing costs. To make a practical budget decision, you must look beyond city-wide medians and examine rent series at the ZIP code level to see what is actually available in your specific area.
The Problem with City-Wide Averages
When you search for rental data, you are frequently presented with a single number representing an entire metropolitan area. This figure is mathematically useful for economists tracking regional trends, but it is rarely useful for an individual renter. Consider a large city where one neighborhood is home to luxury high-rises and the next is dominated by modest, older single-family homes. A city-wide average effectively cancels out the affordability of the latter by inflating it with the high costs of the former.
Regional averages also rely heavily on survey vintages and local economic conditions that may be outdated or skewed by a few high-value developments. When you look at the U.S. Census Bureau ACS 5-year estimates or HUD Fair Market Rent (FMR) data, understand that these numbers are designed to capture broad trends. They do not account for the specific lifestyle factors—such as proximity to transit or school district quality—that make one ZIP code twice as expensive as its neighbor just five miles away.
Understanding Localized Housing Data
To move past the limitations of city-wide metrics, you need to rely on localized series, such as Small Area FMR provided by HUD. These metrics are designed to capture rent variance within metropolitan boundaries. When you analyze a specific ZIP code, you are viewing a snapshot of a market with its own unique supply-demand dynamics.
By focusing on Areal's ZIP-level market index, you gain clarity on how home values and rent costs interact locally. This approach reveals whether a neighborhood is historically expensive relative to local incomes, which is often masked in a broader city analysis. When you browse city rental markets or look into specific neighborhoods, you are essentially filtering out the "noise" of the wider region to see the price points that actually apply to your rental search.
Worked example
To illustrate why local data is essential, let us look at the report for ZIP 97229 in Washington County, Oregon. According to Areal's ZIP-level market index, which pulls from Census ACS, HUD, and FHFA data, we can derive key housing metrics that tell a very specific story.
First, we look at the price-to-rent ratio. If the median home value is $723,247 and the HUD Fair Market Rent for a 2-bedroom is $2,223 per month, the annual cost of rent is $26,676 ($2,223 × 12). Therefore, the price-to-rent calculation is: $723,247 ÷ $26,676 = 27.1x. This suggests that the cost to buy a home in this ZIP is 27.1 times the annual cost to rent a 2-bedroom unit.
Second, we compare this to local income to determine affordability. With a median household income of $107,772, the price-to-income ratio is $723,247 ÷ $107,772 = 6.7x. In most markets, a ratio above 5x is considered historically expensive. These figures, derived from the [the ZIP 97229 report](/zip/97229), show how specific economic factors define a neighborhood far better than a general city-wide average ever could.
How to evaluate your rental options
When you assess your next rental, start by ignoring the "average" rent for the city. Instead, establish your own constraints. Use the following steps to evaluate a specific location:
- Define your target ZIP codes rather than your target city.
- Verify the HUD FMR for that specific ZIP to see the baseline for that area.
- Compare that rent to the median income of that ZIP to see how it aligns with local earning power.
By doing this, you avoid the trap of paying a premium for a neighborhood that is statistically inflated by wealthy sub-sectors. You can run a free ZIP analysis to see how different neighborhoods compare to one another on a level playing field.
Frequently asked questions
Why is the city-wide average rent different from the rent I see in listings? City-wide averages represent a broad, blended figure that includes a wide variety of housing stock and neighborhoods. Real-world listings reflect the specific premium of an individual property's age, amenities, and current micro-market demand.
How does the U.S. Census Bureau contribute to rental data? The Census Bureau provides the ACS 5-year estimates, which offer the most comprehensive view of household incomes and population demographics. These datasets form the foundation for understanding whether a specific ZIP is becoming more or less affordable relative to its residents' earnings.
What does a high price-to-rent ratio tell a renter? A high price-to-rent ratio indicates that the cost of purchasing a home is high relative to the cost of renting. While this often signals that a market is expensive to buy into, it does not necessarily mean renting is cheap; it simply defines the relationship between the two housing paths in that specific ZIP.
Are HUD Fair Market Rent figures accurate for my specific building? HUD Fair Market Rent is a statistical benchmark used primarily for government programs, and it is not a direct reflection of every available apartment. It is, however, one of the most reliable and transparent indicators of the baseline rental cost for a particular county or ZIP code.
Check your own ZIP
Market conditions shift frequently, and relying on outdated or overly broad data can lead to poor financial decisions. To get the most accurate picture of your neighborhood’s market, run a free ZIP analysis using Areal’s database to see the latest figures for your specific area.
Put the method to work
Run a free ZIP-level market screen on Areal — home value and rent trends, HUD fair market rent, county income, crime, and an estimated cash flow, with every source shown.
Run a free analysis